Smart PDU and Per-Device Power Monitoring for Your Homelab
Running a homelab without power monitoring is like driving without a speedometer. You know you are using electricity, but you have no idea how much, which devices are the biggest consumers, or whether that new server you added is costing you $5 a month or $50. Per-device power monitoring answers these questions and pays for itself by identifying equipment that consumes more than it should.
Photo by Aaron Lefler on Unsplash
A smart plug tells you that your server draws 85 watts. A smart PDU tells you that server A draws 85W, server B draws 120W, the NAS pulls 45W, and the switch uses 12W — all from a single device, all at the same time, all accessible via SNMP or an API. When you can see exactly where every watt goes, you make better decisions about hardware purchases, cooling, and which services are worth their electricity cost.
Why Per-Device Monitoring Matters
Aggregate power monitoring (a single meter for your whole rack or shelf) tells you the total. Per-device monitoring tells you the story behind that total.
Identify power hogs: That used Dell R720 you got for $150 might pull 250W at idle — $350 per year in electricity. An Intel N100 mini PC doing the same workload pulls 10W. Per-device monitoring makes the ROI calculation obvious.
Catch anomalies: A server suddenly drawing 40% more power than usual could indicate a failed fan (CPU throttling and power cycling), a runaway process, or a dying power supply. Without monitoring, you would not notice until something fails.
Right-size your UPS: Your UPS is rated for a certain wattage. Per-device monitoring tells you your actual load versus capacity, when you are approaching the limit, and how long your battery runtime really is under current load.
Calculate true cost of ownership: When evaluating whether to self-host a service or use a cloud provider, the electricity cost is a real factor. Per-device monitoring gives you exact numbers instead of guesses.
Smart PDU Options
Smart PDUs range from consumer-grade power strips to enterprise rack-mount units. Here are the practical options for homelab use.
Enterprise Rack PDUs
These are the gold standard — per-outlet monitoring, SNMP/API access, remote switching, and metered input current.
| Model | Outlets | Monitoring | Protocol | Price Range |
|---|---|---|---|---|
| APC AP8641 (Metered Rack) | 21 | Per-outlet | SNMP, HTTP | $200-400 used |
| CyberPower PDU81005 | 24 | Per-outlet | SNMP, HTTP | $300-500 used |
| Raritan PX3-5466R | 24 | Per-outlet | SNMP, REST | $250-450 used |
| Tripp Lite PDUMNH20HV | 20 | Per-outlet | SNMP, HTTP | $200-350 used |
| ServerTech CWG-24VYM415C6 | 24 | Per-outlet | SNMP, REST | $150-300 used |
Enterprise PDUs show up on eBay regularly as data centers refresh equipment. A used APC or CyberPower metered PDU for $200-300 gives you capabilities that would cost $800+ new. Check that the voltage and plug type match your setup — many enterprise PDUs are 208V/30A (L6-30P), which requires a dedicated circuit. For typical homelab use on a standard 120V/15A or 20A circuit, look specifically for NEMA 5-15P or 5-20P input models.
Consumer Smart Power Strips
For homelabs without a rack, smart power strips offer per-outlet monitoring at a fraction of the cost.
| Model | Outlets | Monitoring | Protocol | Price |
|---|---|---|---|---|
| TP-Link Kasa KP303 | 3 | Per-outlet | Local API, cloud | ~$25 |
| Emporia Vue Smart Plug | 1 | Per-device | Cloud + local | ~$15 |
| Shelly Plug S / Plus Plug | 1 | Per-device | REST, MQTT | ~$18 |
| Sonoff S31 | 1 | Per-device | Tasmota flash | ~$10 |
| Ubiquiti USP-Strip | 6 | Per-outlet | UniFi | ~$100 |
The Shelly plugs deserve special mention. They speak MQTT natively, have a local REST API, and do not require cloud connectivity. For a homelab, this matters — you want monitoring that keeps working even when your internet is down.
The Sonoff S31 is the cheapest option if you are willing to flash Tasmota firmware, which gives you MQTT support and removes the cloud dependency.
Dedicated Whole-Circuit Monitors
For monitoring your entire homelab circuit (or your whole house), clamp-on current transformers offer high accuracy without modifying any outlets:
- Emporia Vue Gen 2 (~$80): 16 circuit-level monitors, cloud-dependent but has local API workarounds
- Sense Energy Monitor (~$300): Whole-panel monitoring with ML-based device detection, cloud-required
- IoTaWatt (~$100): Open-source, local-only, supports up to 14 CTs
IoTaWatt is the homelab favorite because it is fully local, speaks HTTP/REST, and integrates directly with InfluxDB for Grafana dashboards.
SNMP Monitoring for Enterprise PDUs
Enterprise PDUs speak SNMP (Simple Network Management Protocol). SNMP gives you real-time access to power, current, voltage, temperature, and individual outlet states.
Discovering SNMP OIDs
Every PDU exposes its data at specific SNMP OIDs (Object Identifiers). To discover what your PDU offers:
# Walk the entire SNMP tree (SNMPv2c)
snmpwalk -v 2c -c public 192.168.1.50

# Walk a specific subtree (power-related MIBs)
snmpwalk -v 2c -c public 192.168.1.50 1.3.6.1.4.1.318.1.1.26  # APC
snmpwalk -v 2c -c public 192.168.1.50 1.3.6.1.4.1.3808         # CyberPower
For an APC Rack PDU, the common OIDs for per-outlet power:
# Outlet power in tenths of watts
1.3.6.1.4.1.318.1.1.26.9.4.3.1.7.1.{outlet_number}

# Outlet current in tenths of amps
1.3.6.1.4.1.318.1.1.26.9.4.3.1.6.1.{outlet_number}

# Outlet name
1.3.6.1.4.1.318.1.1.26.9.4.3.1.3.1.{outlet_number}
SNMPv3 (Recommended)
SNMPv2c sends community strings in plaintext. For a homelab, this is usually fine if SNMP is on an isolated management VLAN. But if security matters:
# Query with SNMPv3 authentication and encryption
snmpwalk -v 3 -u monitorUser -l authPriv \
  -a SHA -A "authPassword123" \
  -x AES -X "privPassword456" \
  192.168.1.50 1.3.6.1.4.1.318.1.1.26
Configure SNMPv3 users through the PDU's web interface. Most enterprise PDUs support SNMPv3 out of the box.
Want more infrastructure guides? Get guides like this in your inbox — HomeLab Starter delivers one free deep-dive every week.
Building a Grafana Dashboard
The real value of power monitoring comes from visualizing trends over time. Grafana with InfluxDB or Prometheus is the standard stack.
Telegraf + InfluxDB + Grafana Stack
Telegraf collects SNMP data, InfluxDB stores it, and Grafana visualizes it.
# docker-compose.yml
services:
  influxdb:
    image: influxdb:2
    restart: unless-stopped
    ports:
      - "8086:8086"
    volumes:
      - ./influxdb/data:/var/lib/influxdb2
    environment:
      DOCKER_INFLUXDB_INIT_MODE: setup
      DOCKER_INFLUXDB_INIT_USERNAME: admin
      DOCKER_INFLUXDB_INIT_PASSWORD: "${INFLUXDB_PASSWORD}"
      DOCKER_INFLUXDB_INIT_ORG: homelab
      DOCKER_INFLUXDB_INIT_BUCKET: power

  telegraf:
    image: telegraf:latest
    restart: unless-stopped
    volumes:
      - ./telegraf/telegraf.conf:/etc/telegraf/telegraf.conf:ro
    depends_on:
      - influxdb

  grafana:
    image: grafana/grafana:latest
    restart: unless-stopped
    ports:
      - "3000:3000"
    volumes:
      - ./grafana/data:/var/lib/grafana
    depends_on:
      - influxdb
Telegraf SNMP Configuration
# telegraf/telegraf.conf
[agent]
  interval = "30s"

[[outputs.influxdb_v2]]
  urls = ["http://influxdb:8086"]
  token = "${INFLUXDB_TOKEN}"
  organization = "homelab"
  bucket = "power"

[[inputs.snmp]]
  agents = ["192.168.1.50"]
  version = 2
  community = "public"
  interval = "30s"

  # Total PDU power
  [[inputs.snmp.field]]
    oid = "1.3.6.1.4.1.318.1.1.26.4.3.1.5.1"
    name = "total_power_watts"
    conversion = "float(1)"

  # Per-outlet power (repeat for each outlet)
  [[inputs.snmp.table]]
    name = "pdu_outlet"
    [[inputs.snmp.table.field]]
      oid = "1.3.6.1.4.1.318.1.1.26.9.4.3.1.3.1"
      name = "outlet_name"
      is_tag = true
    [[inputs.snmp.table.field]]
      oid = "1.3.6.1.4.1.318.1.1.26.9.4.3.1.7.1"
      name = "power_watts"
      conversion = "float(0.1)"
    [[inputs.snmp.table.field]]
      oid = "1.3.6.1.4.1.318.1.1.26.9.4.3.1.6.1"
      name = "current_amps"
      conversion = "float(0.1)"
For MQTT-Based Devices (Shelly, Tasmota)
If your power monitoring comes from MQTT devices instead of SNMP PDUs, Telegraf handles that too:
[[inputs.mqtt_consumer]]
  servers = ["tcp://mosquitto:1883"]
  topics = [
    "shellies/+/relay/0/power",
    "tasmota/+/tele/SENSOR"
  ]
  data_format = "value"
  data_type = "float"
  topic_tag = "device"
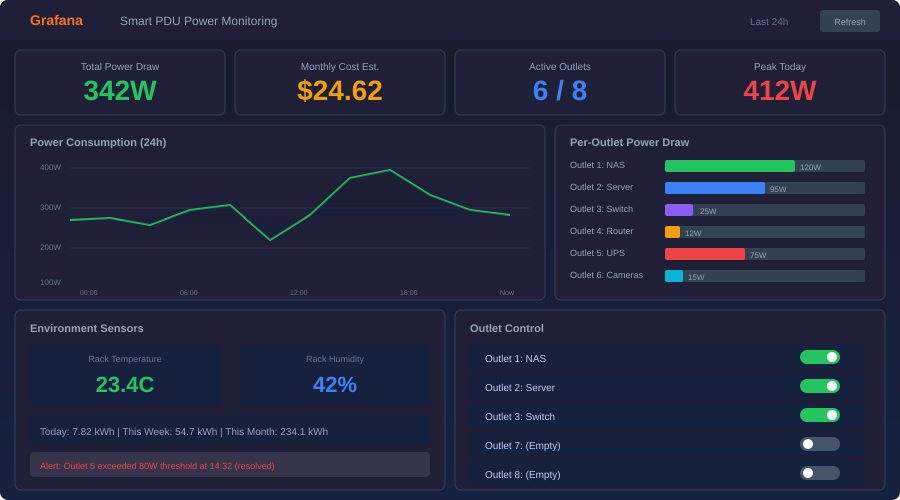
Grafana Dashboard Panels
The most useful panels for a power monitoring dashboard:
- Total rack power (gauge): Current total wattage with thresholds (green/yellow/red based on circuit capacity)
- Per-device power (bar chart): Side-by-side comparison of every device's current draw
- Power over time (time series): 24-hour and 7-day trends per device, stacked to show total
- Monthly cost estimate (stat panel):
(watts / 1000) * 24 * 30.44 * cost_per_kwhcalculated in the query - Anomaly alerts: Grafana alerts when a device exceeds its normal power band by more than 20%
Calculating Rack Efficiency
With per-device monitoring data, you can calculate practical efficiency metrics.
Power Usage Effectiveness (PUE)
PUE is a data center metric that measures how much overhead power (cooling, networking, UPS losses) your compute equipment requires:
PUE = Total Facility Power / IT Equipment Power
For a homelab, "total facility power" is whatever your UPS or circuit meter reads, and "IT equipment power" is the sum of your servers, NAS, and switches. A PUE of 1.0 is perfect (no overhead). Most homelabs achieve 1.1-1.3 because UPS efficiency losses are the main overhead.
Cost Per Service
Divide each device's monthly electricity cost by the services it runs:
Monthly cost = (watts * 24 * 30.44 * $/kWh) / 1000

Example:
- Server A: 85W → $9.86/month at $0.16/kWh
- Runs: Plex, Home Assistant, Pi-hole, Unbound (4 services)
- Cost per service: ~$2.47/month
This puts self-hosting costs in context. If running Plex yourself costs $2.47/month in electricity (plus amortized hardware costs), and a Plex Pass is $5/month... the math works. If a single-purpose server draws 200W to run one lightweight service, maybe that service belongs on a shared host.
Cost Optimization Strategies
Once you have data, use it.
Consolidate low-utilization servers: If two servers each run at 15% CPU utilization, combining their workloads on one server saves the full idle power draw of the second machine.
Schedule non-critical workloads: Run backups, media transcoding, and other batch jobs during off-peak electricity hours if your utility has time-of-use pricing. Wake-on-LAN can power on a dedicated processing server only when needed.
Replace power-hungry hardware: That $150 used server pulling 250W costs more in electricity over 2 years ($876) than replacing it with two N100 mini PCs at 10W each ($70/year total). Per-device monitoring makes this calculation concrete.
Right-size your UPS: If your total load is 400W but your UPS is rated for 1500VA, you have more runtime than you need. Conversely, if you are at 80% of UPS capacity, you need to add capacity before adding hardware.
Monitor standby power: Devices in "standby" or "idle" still draw power. A monitor that is off but plugged in might draw 1-3W. Individually trivial, but ten standby devices at 2W each is 175 kWh per year.
Per-device power monitoring is one of those homelab investments that seems unnecessary until you have it, and then you wonder how you managed without it. Start with a few smart plugs on your biggest consumers, get the data into Grafana, and let the numbers guide your optimization decisions.